le titre du livre — 3. Generating value for our customers and company
3
Generating value for our customers and company
The Journal Development (JDev) team’s purpose is simple: to make sure our customers get the most value and impact from our journals.
We will be the most successful and generate the most revenue when our customers have the best experience when interacting with our journals. Such customers will gladly pay for the services we provide, come back to us time and time again, and recommend our journals to their peers — creating a cycle of engagement and return that produces value for everyone involved.
How do we define value?
Scholarly journals produce value for different audiences by providing a space for:
- authors to improve and share their research
- readers to discover and understand more about their area of research
- editors and reviewers to engage with and advance research
- publishers to generate revenue and grow their publishing programs and commercial services
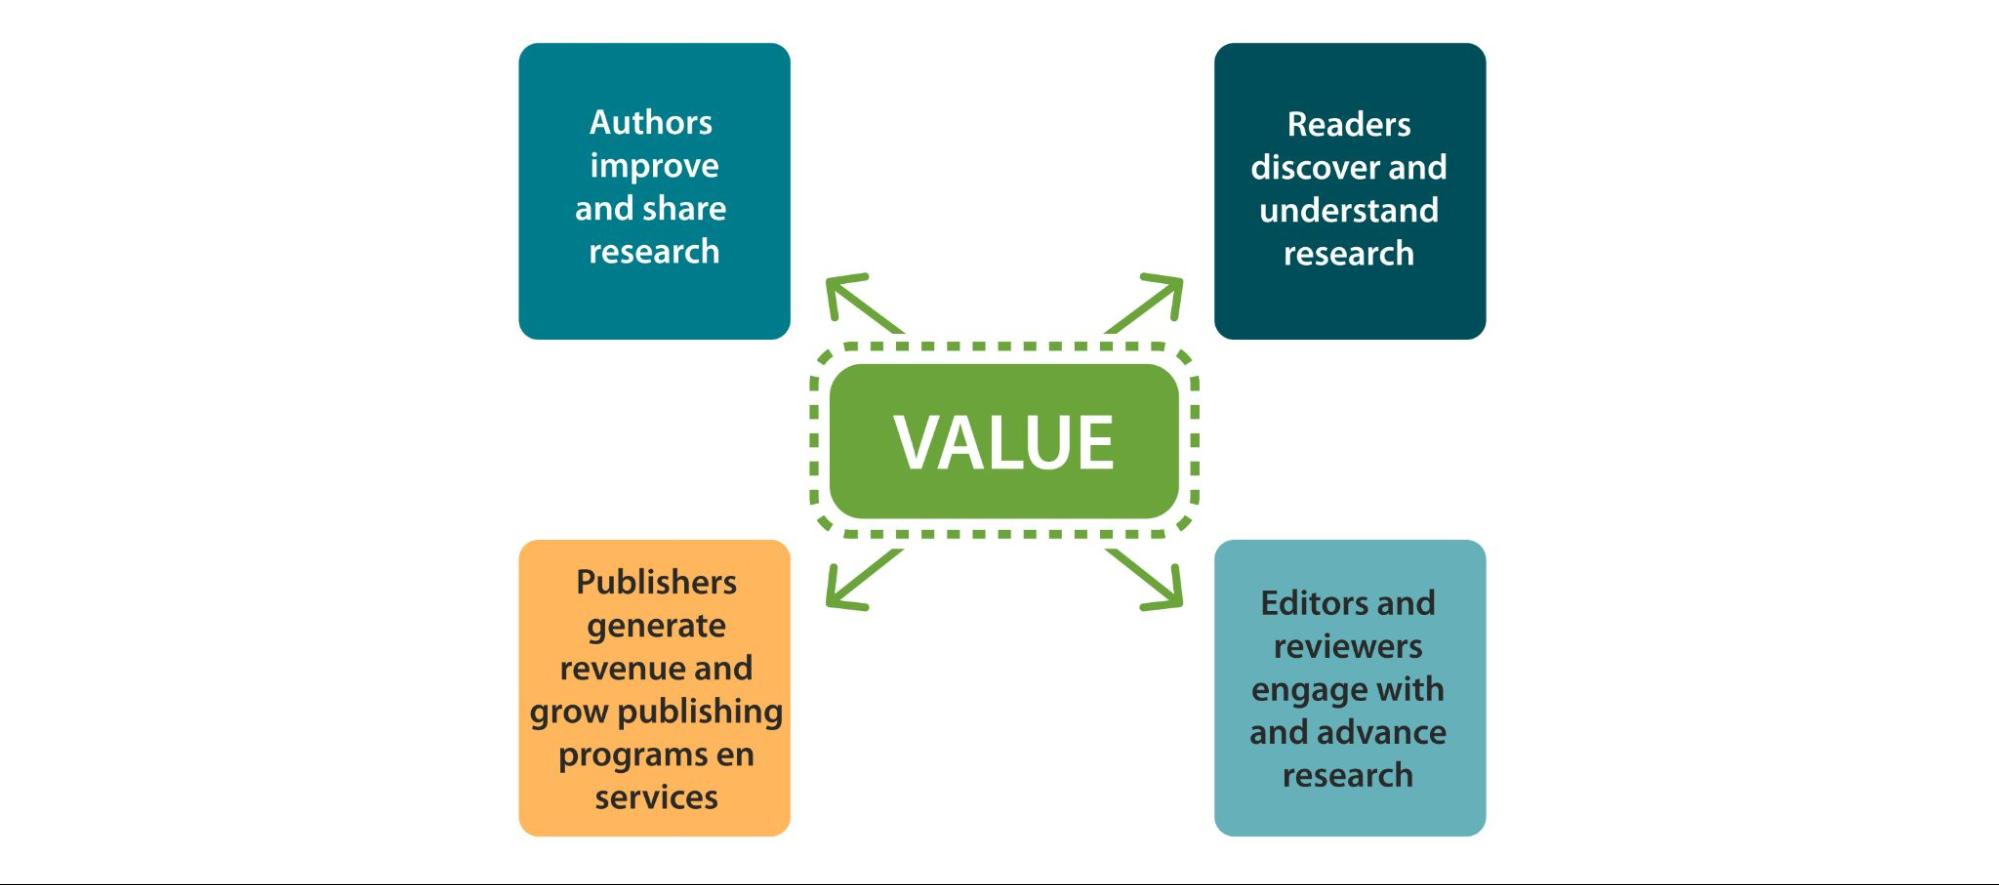
We work to create harmony between these different components for all our researcher customer groups, while also simultaneously creating value for us, the publisher.
We achieve this via the customer-focused structure of the teams within JDev (different researcher-as-customer groups: authors, editors, reviewers, and readers; but also, product types and regions) with those teams having a clear range of metrics and targets that support value generation in each of these groups.
How do we measure value?
Within JDev, four key metrics support value generation for our journals, all with clear, quantifiable monthly targets:
- Submissions
- Usage
- Citations
- Net Promoter Score (NPS)

All JDev teams have corresponding metrics and targets that feed into these four overarching metrics, providing cohesion and clarity to the activity done by teams within — and beyond — Journal Development.
By achieving strong results in these metrics, we demonstrate the value and impact that our researcher groups, as well as the wider research community, gain from our journals. This helps secure our journals’ future commercial viability.
Understanding our researcher groups is vital to driving valueTo enable us to best provide the value that we aim to create for everyone interacting with our journals, we need to understand who they are and provide experiences that will create lasting value for them. To do this, we have an extensive and sophisticated tracking and engagement infrastructure — this enables us to have an incredibly rich understanding of our authors, editors, and reviewers, and how they interact with our journals. This information helps us improve our services, identify pain points, find new opportunities to create value, and drive the ongoing impact and usefulness of our journals. This infrastructure underpins the work that all of the varied and blended teams do within Journal Development and enables us to continually focus on creating value at multiple levels, both commercially and more broadly. |
Submissions
Vital to our journal’s commercial success are the Article Processing Charges (APC) — payments made by the authors of an article once their manuscript has been accepted for publication. Achieving this success not only ensures our growth as a company but also makes certain that our journals will continue to serve their communities.
The number of submissions a journal receives helps predict the number of paid APCs it will generate, and so submissions are the leading indicator of a journal’s commercial potential.
Additionally, the number of submissions we generate for a journal is a commercial value that can only be realized if the research is of the scope and quality that it gets accepted. Equally, this acceptance of scope and quality should also create value for our editors, reviewers, and readers by enriching their experience of our journals.
We also provide a wide-ranging waiver program for researchers in lower-and-middle-income countries that supplies either 100% or 50% waivers for their APCs. Those submissions that receive any kind of waiver are termed ‘waived articles’ and those that do not are termed ‘priced articles.’ This means that a proportion of our accepted articles (~20% on average) either generate zero or reduced revenue when compared to the standard APC of the journal. We see this as a vital service we provide in ensuring the barriers to publishing are reduced as much as possible.
We project the commercial value of a journal based on submissions through a straightforward calculation of Projected Revenue:

Additionally, to understand the value of the activity we do in Journal Development to generate submissions, we utilize a separate formula that considers all spend in the department on systems, campaigns, and other activities (sponsorships, platforms, commercial outlays, etc.) that we can directly attribute to generating submissions — termed ‘attributable submissions.’
This formula enables us to understand how cost effective we have been in supporting submissions and producing Return on Investment (ROI) %:
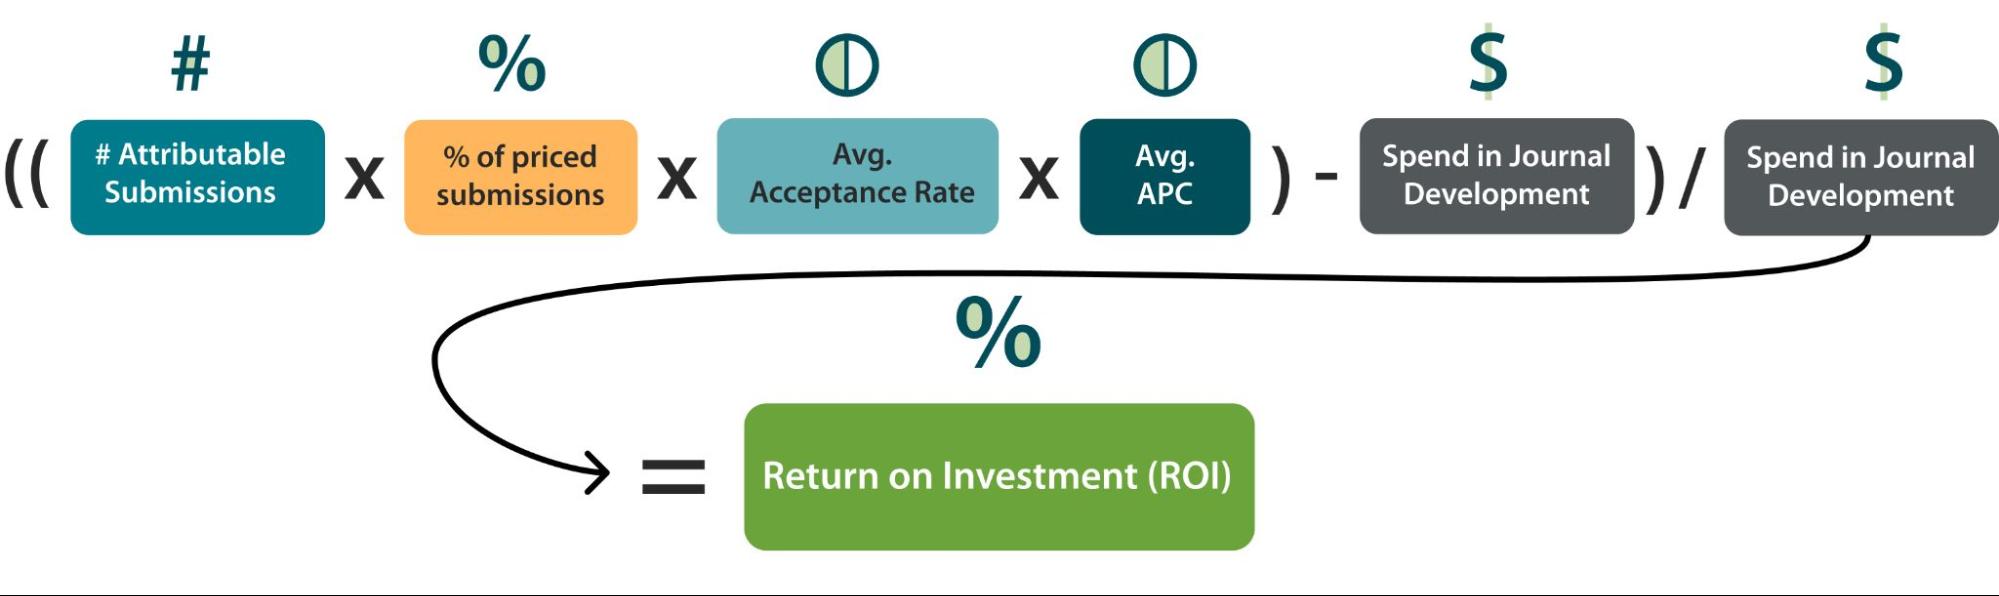
We have a sophisticated, industry-leading process for tracking attribution of our activities in Journal Development to submissions generated — more details on this are in the Data and Systems chapter. Historically, Journal Development activity can be directly attributed to 30%+ of all submissions generated each month and we regularly achieve 5-6 times the value of what we spend in Journal Development to generate submissions.
Attribution and the characteristics of usersTo understand the value of our activity to help drive submissions (as well as increase usage and submissions) we utilize a model that tracks the interactions of users with our activity (e.g. email messages, social media activity, paid media, etc.) and cross-references that with their actions on our site (e.g. making a submission, reading content, citing content, etc.) — this enables us to directly attribute the activity we carry out with the actions they carry out. Through this model, we can demonstrate the direct impact of our activity and calculate the value of that activity (as shown in the ROI calculation in this chapter). This tracking model provides us with key user characteristics such as likelihood to publish, their success rate in the peer review process, their capability to pay APCs, editor performance, reviewer rate of return, among many others, which in turn powers us to build customer profiles. Having robust attribution and a wide range of researcher-specific characteristics enables us to best ensure that we can accurately understand and create value for our researcher customers. |
Our approach to generating submissions is very much in line with the overall concept of value in Journal Development — to create value for all our users. Our aim is never to indiscriminately drive submissions, regardless of the quality, but instead, to leverage our customer profiles to target those we predict to have a higher chance of acceptance. A researcher’s history of success, their research being within the scope of the journal, or their other existing relationships with us, are just some factors used to determine whether that researcher is likely to be successful in publishing.
We want to make sure that the authors submitting to our journals have the best experience (acknowledging that a key factor in this is their being successful in getting published) but also that our editors and reviewers have the best experience (by engaging with relevant research), and our readers have the best experience (by discovering research that is useful to them). An individual researcher can simultaneously play a role in each of these customer groups and so by creating these improved experiences for all of our researcher customer groups we increase engagement, satisfaction, and likelihood to re-engage with us on multiple fronts.
Usage
In Journal Development, we consider usage as one of the two leading indicators of engagement with journals, with the other being Citations. We view ‘usage’ as HTML and PDF reads of article content and track such usage through automated web-based systems that allow us to understand how much article content is being used.
Usage has long been an important measure of value for a journal — this is how the value was traditionally conveyed to subscription customers in the historical models of publishing i.e., ‘your users read X number of articles through your subscription.’ However, in the researcher-first open access model, the value of usage has increased. It now both encapsulates how much a journal as a whole is engaged by its relevant research community and presents how much value the individual authors of articles get from their articles being published in a journal — this is a measure of how much their peers and other relevant people are reading their research.
We present article usage data directly on article pages (as views and downloads) and share this data directly with authors about their articles regularly. This is part of our drive to help authors understand the impact of their research, and therefore the value of their choosing to publish in our journals.
Additionally, we share journal-level usage data through our publicly available Journal Reports which showcase the usage impact of a journal and its geographical spread to benefit all of the researcher groups (authors, editors, reviewers, and readers), as well as other stakeholders (funders, institutions, etc.).
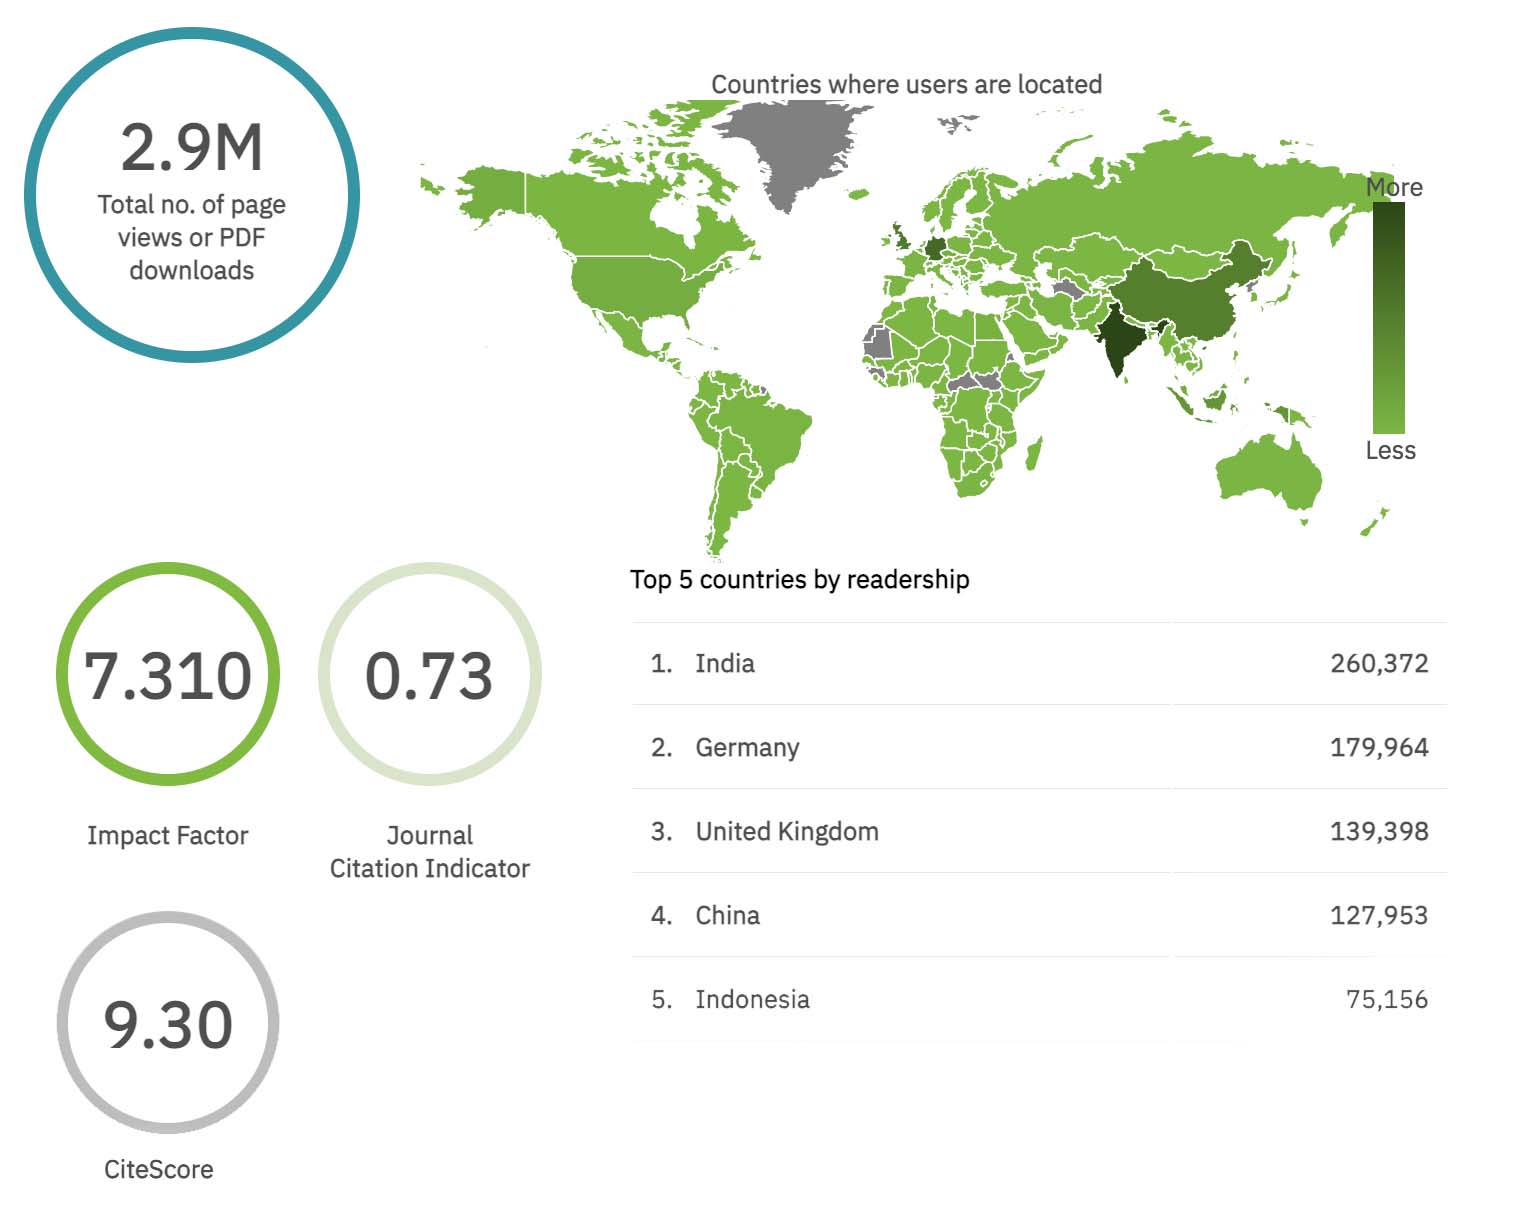
An example journal report breaking down top countries, Journal Citation Indicator, Citescore, Downloads, and Impact Factor
Our drive to increase usage has multiple impacts:
- it increases the value of publishing in our journals for our authors
- it increases the value of prestige for our editors through work in their journal being widely read
- it ensures that the value of our journals to our readers is continuously growing.
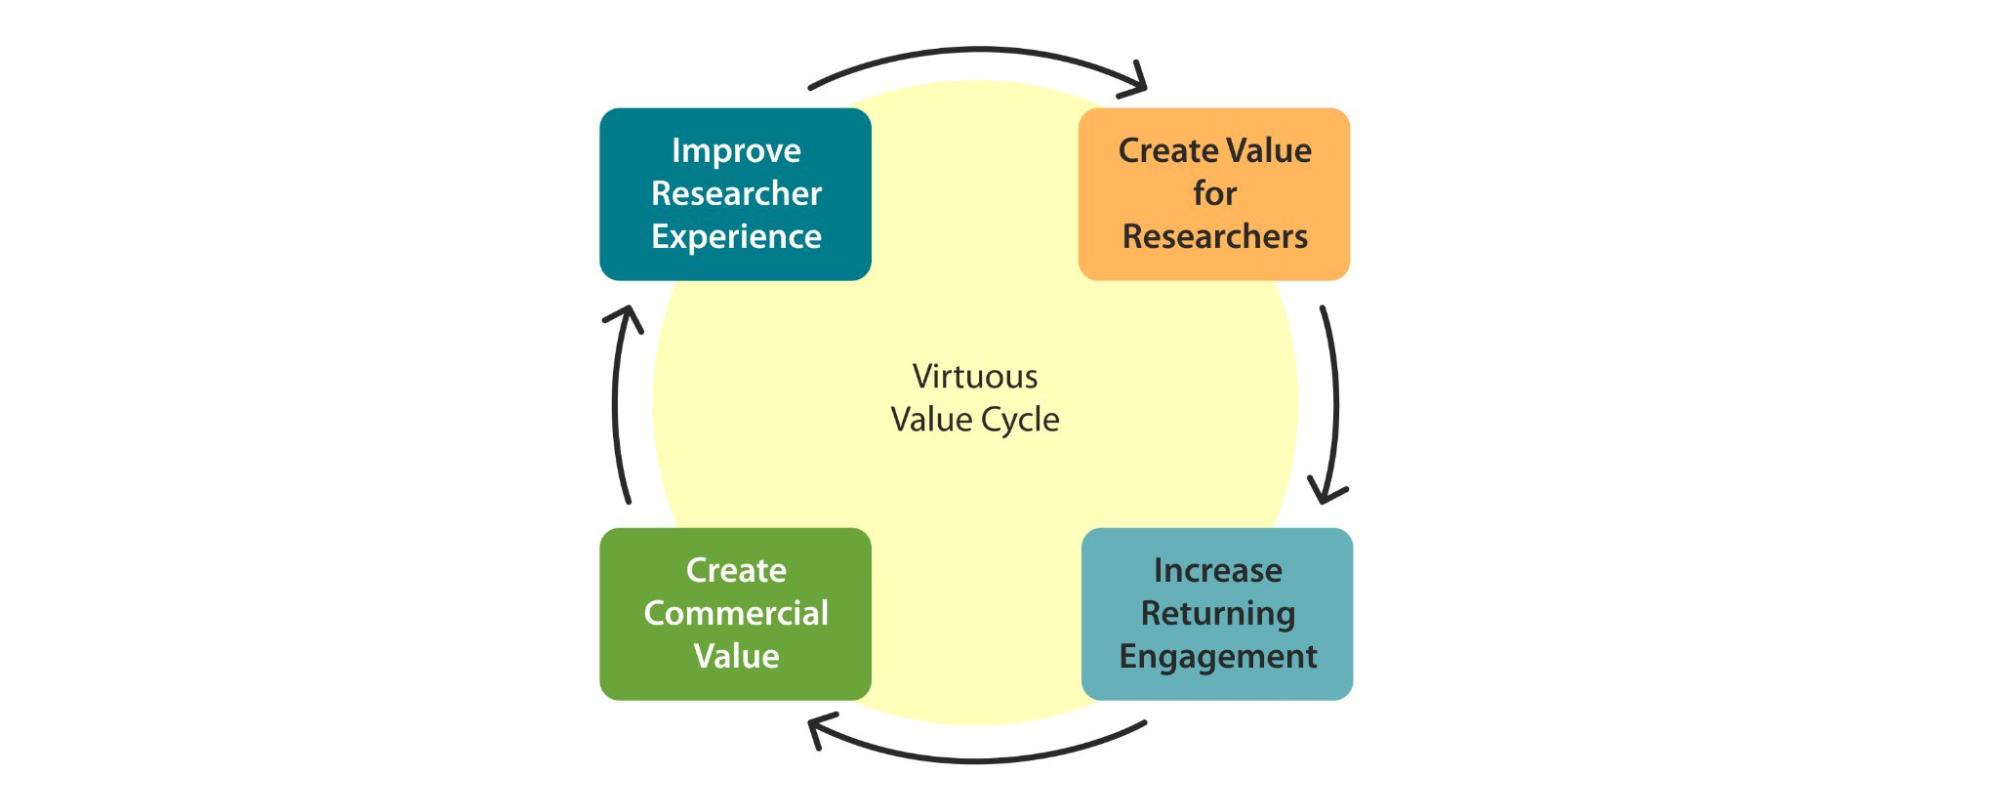
By supporting value generation for these three groups, we create a stronger likelihood that researchers will continue to engage with our journals, derive further value from them going forward, and so support a virtuous cycle of engagement and return.
Citations
Citations are an important way in which researchers understand the reach and impact of articles. It is, therefore, a key metric for us to understand the value of our journals.
Citations are tracked in many ways by many different systems. We use a combination of two of the leading indexers to track and understand the citation impact of our articles — Dimensions and Web of Science.
We present citation data alongside usage reported on our articles to ensure that these two indicators of impact are clear to readers.
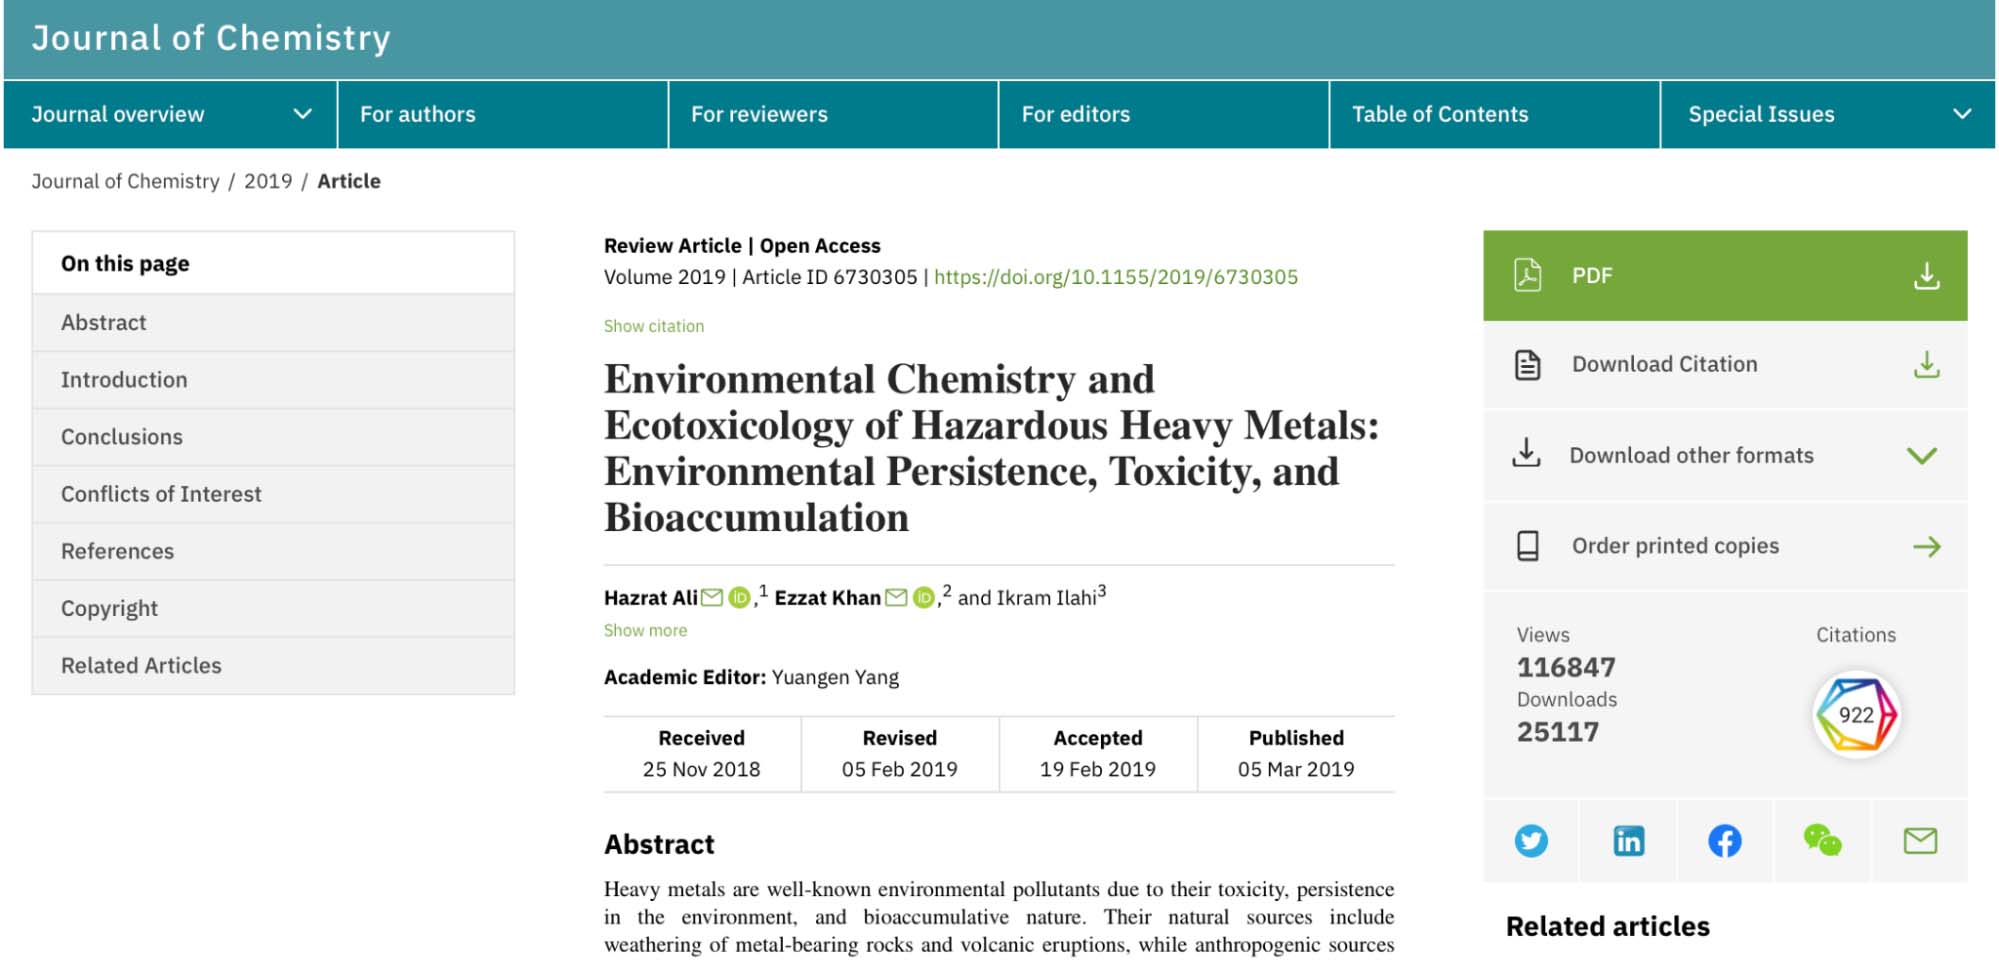
An example of manuscript statistics available on article pages
We also continuously track citations for all journals indexed on Web of Science to enable us to project the potential Impact Factor of all such journals. While Impact Factor is agreed to be a flawed metric, it is still the most widely utilized metric by researchers when assessing the “quality” of a journal and therefore is of intrinsic value to our researcher groups. For these reasons we also continually project the number of citations we need in a journal to improve its Impact Factor, as well as the number of citations needed to see a continual increase in citations for the title.
Combined, these two projections provide an understanding of the citation impact of a title and the citation value it generates for our researcher groups — who will in turn be more likely to return to engage with our journals, as well as promote our journals to their colleagues and peers.
Net Promoter Score (NPS)
The previous three metrics have enabled us to understand the direct commercial value of our journals, as well as the individual product and article value to our customers. The final key metric in Journal Development provides us with a clear indicator of our researcher groups’ satisfaction with their experience interacting with our titles. This metric enables us to predict the likelihood of a researcher promoting our services to their peers and of them re-engaging with our journals.
Net Promoter Score (NPS) is a widely used measure to understand how likely a customer is to recommend a product or service to someone else. While it has its limitations, NPS provides an objective indication of a person’s sentiment towards a service, as well as their intent to promote it.
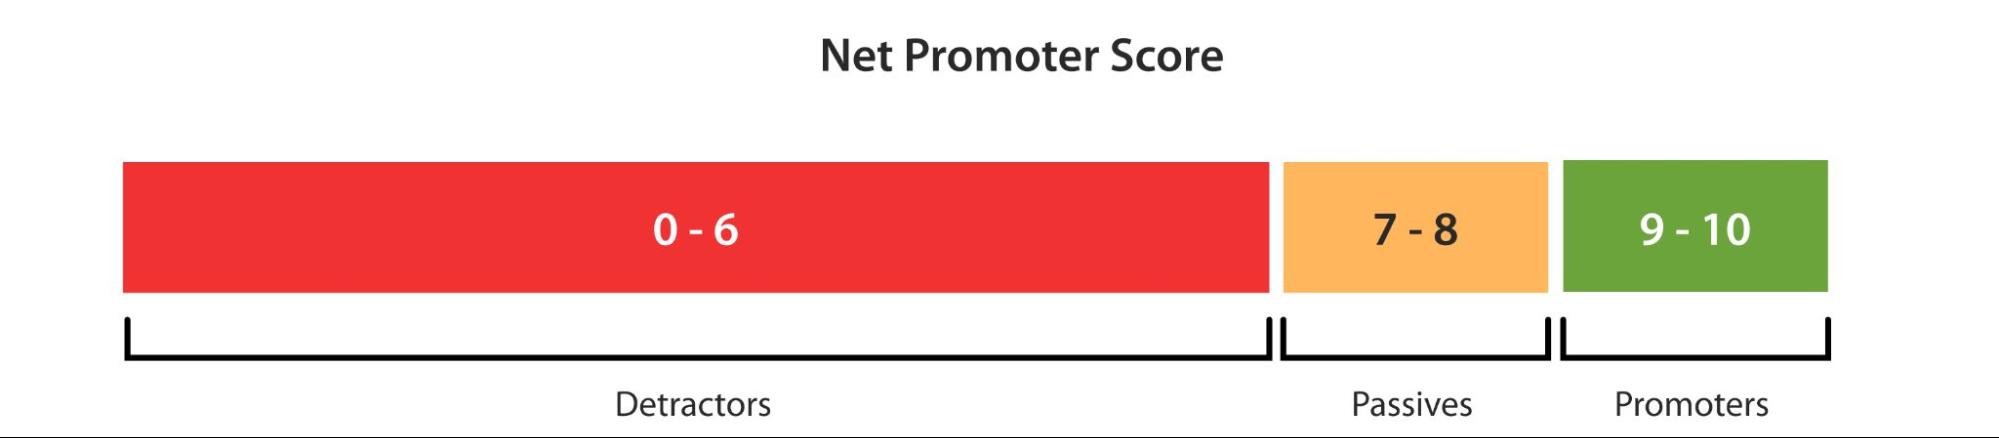
NPS is calculated based on the answers of customers to a single question:
“On a scale of 0 to 10, how likely are you to recommend X to a friend or colleague?”
The NPS calculation then divides all answers into three groups — Detractors (0-6), Passives (7-8), and Promoters (9-10).
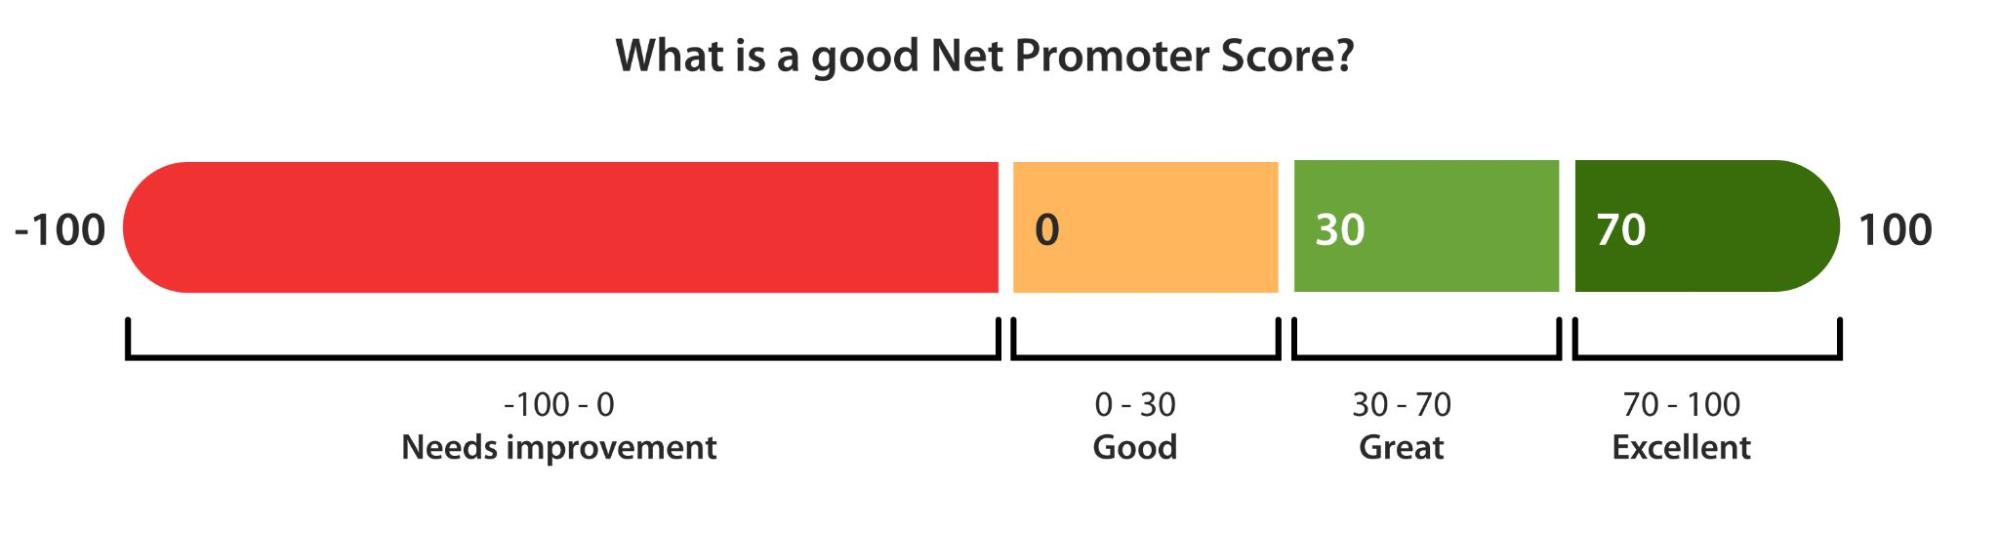
A calculation is then performed to provide a score of -100 to 100:

A score of 0+ means that more people scored 9-10 than scored 0-6, meaning that the product or service is more likely to be promoted than denigrated. Only those that have scored it highest are positively counted, while those in the upper middle are discounted. As such, this provides a very clear measure of how well our researcher groups are rating their experience with our journals.
We collect NPS data for three of our researcher groups: authors, editors, and reviewers. This allows us to create an overall aggregate score for our performance as a whole. A score of 30+ is considered to be good and is therefore the benchmark we set for all of our researcher groups.
l
By understanding the NPS of all our researcher groups, we determine the overall satisfaction and health of our core customers. This enables us to predict researchers’ likelihood of promoting our journals within their respective research communities and working with us again.
What creates lasting value for our researcher groups?
Throughout these four key metrics, there is a consistent thread: engagement and return. This is the true value we create, on a commercial level for us as a company, as well as at a customer satisfaction level for the research communities we serve.
If authors, editors, reviewers, and readers return to us over and over — whether that is to publish, edit, review, or read articles — they will continually produce commercial value for our company. This, in turn, enables us to provide greater value back into the wider research community with the introduction of new engagement initiatives that improve the publishing experience for each individual researcher group — driving the virtuous value cycle.
Beyond our key metricsThroughout this chapter, we have looked at how we track and understand the value we generate for our researcher groups. These key metrics are focused on the experience of researchers within our journals with specific regard to the development and publication of articles — this is the clearest way we can demonstrate and ensure clarity of purpose for the teams within Journal Development. However, this is not the full extent to which the teams within Journal Development add value for our researcher groups and the wider publishing community. Our collaboration with partner departments (Editorial and Publishing Operations, Partnerships, and Product), consolidates Journal Development’s contribution to a multitude of less directly quantifiable types of value. For example, our teams support the development of user-friendly systems and processes and the implementation of policies aimed at upholding the publication and dissemination of important research. While all these value types impact the key metrics of Journal Development, their influence extends beyond the impact and usage of published articles. Our commitment to developing a long-lasting and robust way of implementing Open Science practices — including the creation of an internationally equitable and effective publishing model — coincides with our dedication to supporting the professional development of our editors and reviewers. All these facets combine to propel forward our overarching mission of providing value to the research communities that we serve. |